

Ethereum is once again a trending topic as its price shows signs of consolidation this week. As of Tuesday, the ETH token was trading at around $2,500, maintaining a steady range that it has occupied for several days. This marks a significant increase of approximately 82% from the lowest price levels observed earlier this year.
ETH Supply on Exchanges is Crashing
One of the main factors influencing the Ethereum market is the notable decline in supply available on exchanges. Over the past few months, the amount of ETH held on exchanges has plummeted from a peak of 10.9 million coins in November to just 7.33 million. This trend is a positive sign, indicating that investors are opting to transfer their assets into self-custody rather than leaving them on exchanges.
This shift in holding behavior is further complemented by the growing interest from Exchange-Traded Funds (ETFs). Recent data reveals that spot Ethereum ETFs have experienced positive net inflows for four consecutive months, bringing total holdings to over $10.83 billion. Major players in this arena include BlackRock’s ETHA, Grayscale’s ETHE and ETH, and Fidelity’s FETH, all of which are contributing significantly to the ongoing supply crunch.
Additionally, the accumulation trend is not limited to institutional investments; top Ethereum addresses have also ramped up their holdings. Currently, these addresses collectively hold over 75 million ETH, a considerable increase from the 59 million observed in July. This accumulation behavior suggests a strong belief in Ethereum’s long-term value among key investors.
READ MORE: Polkadot Price Prediction as Analyst Explains the DOT Crash
Another bullish indicator is the MVRV (Market Value to Realized Value) score for ETH, which currently sits at minus 0.06. This metric, which compares the asset’s market value to its realized value, highlights that Ethereum is trading significantly cheaper compared to last year’s peak of 1.41. In essence, a negative MVRV score generally indicates that an asset is undervalued.
ETH supply in exchanges | Source: Santiment
Ethereum Price Technical Analysis
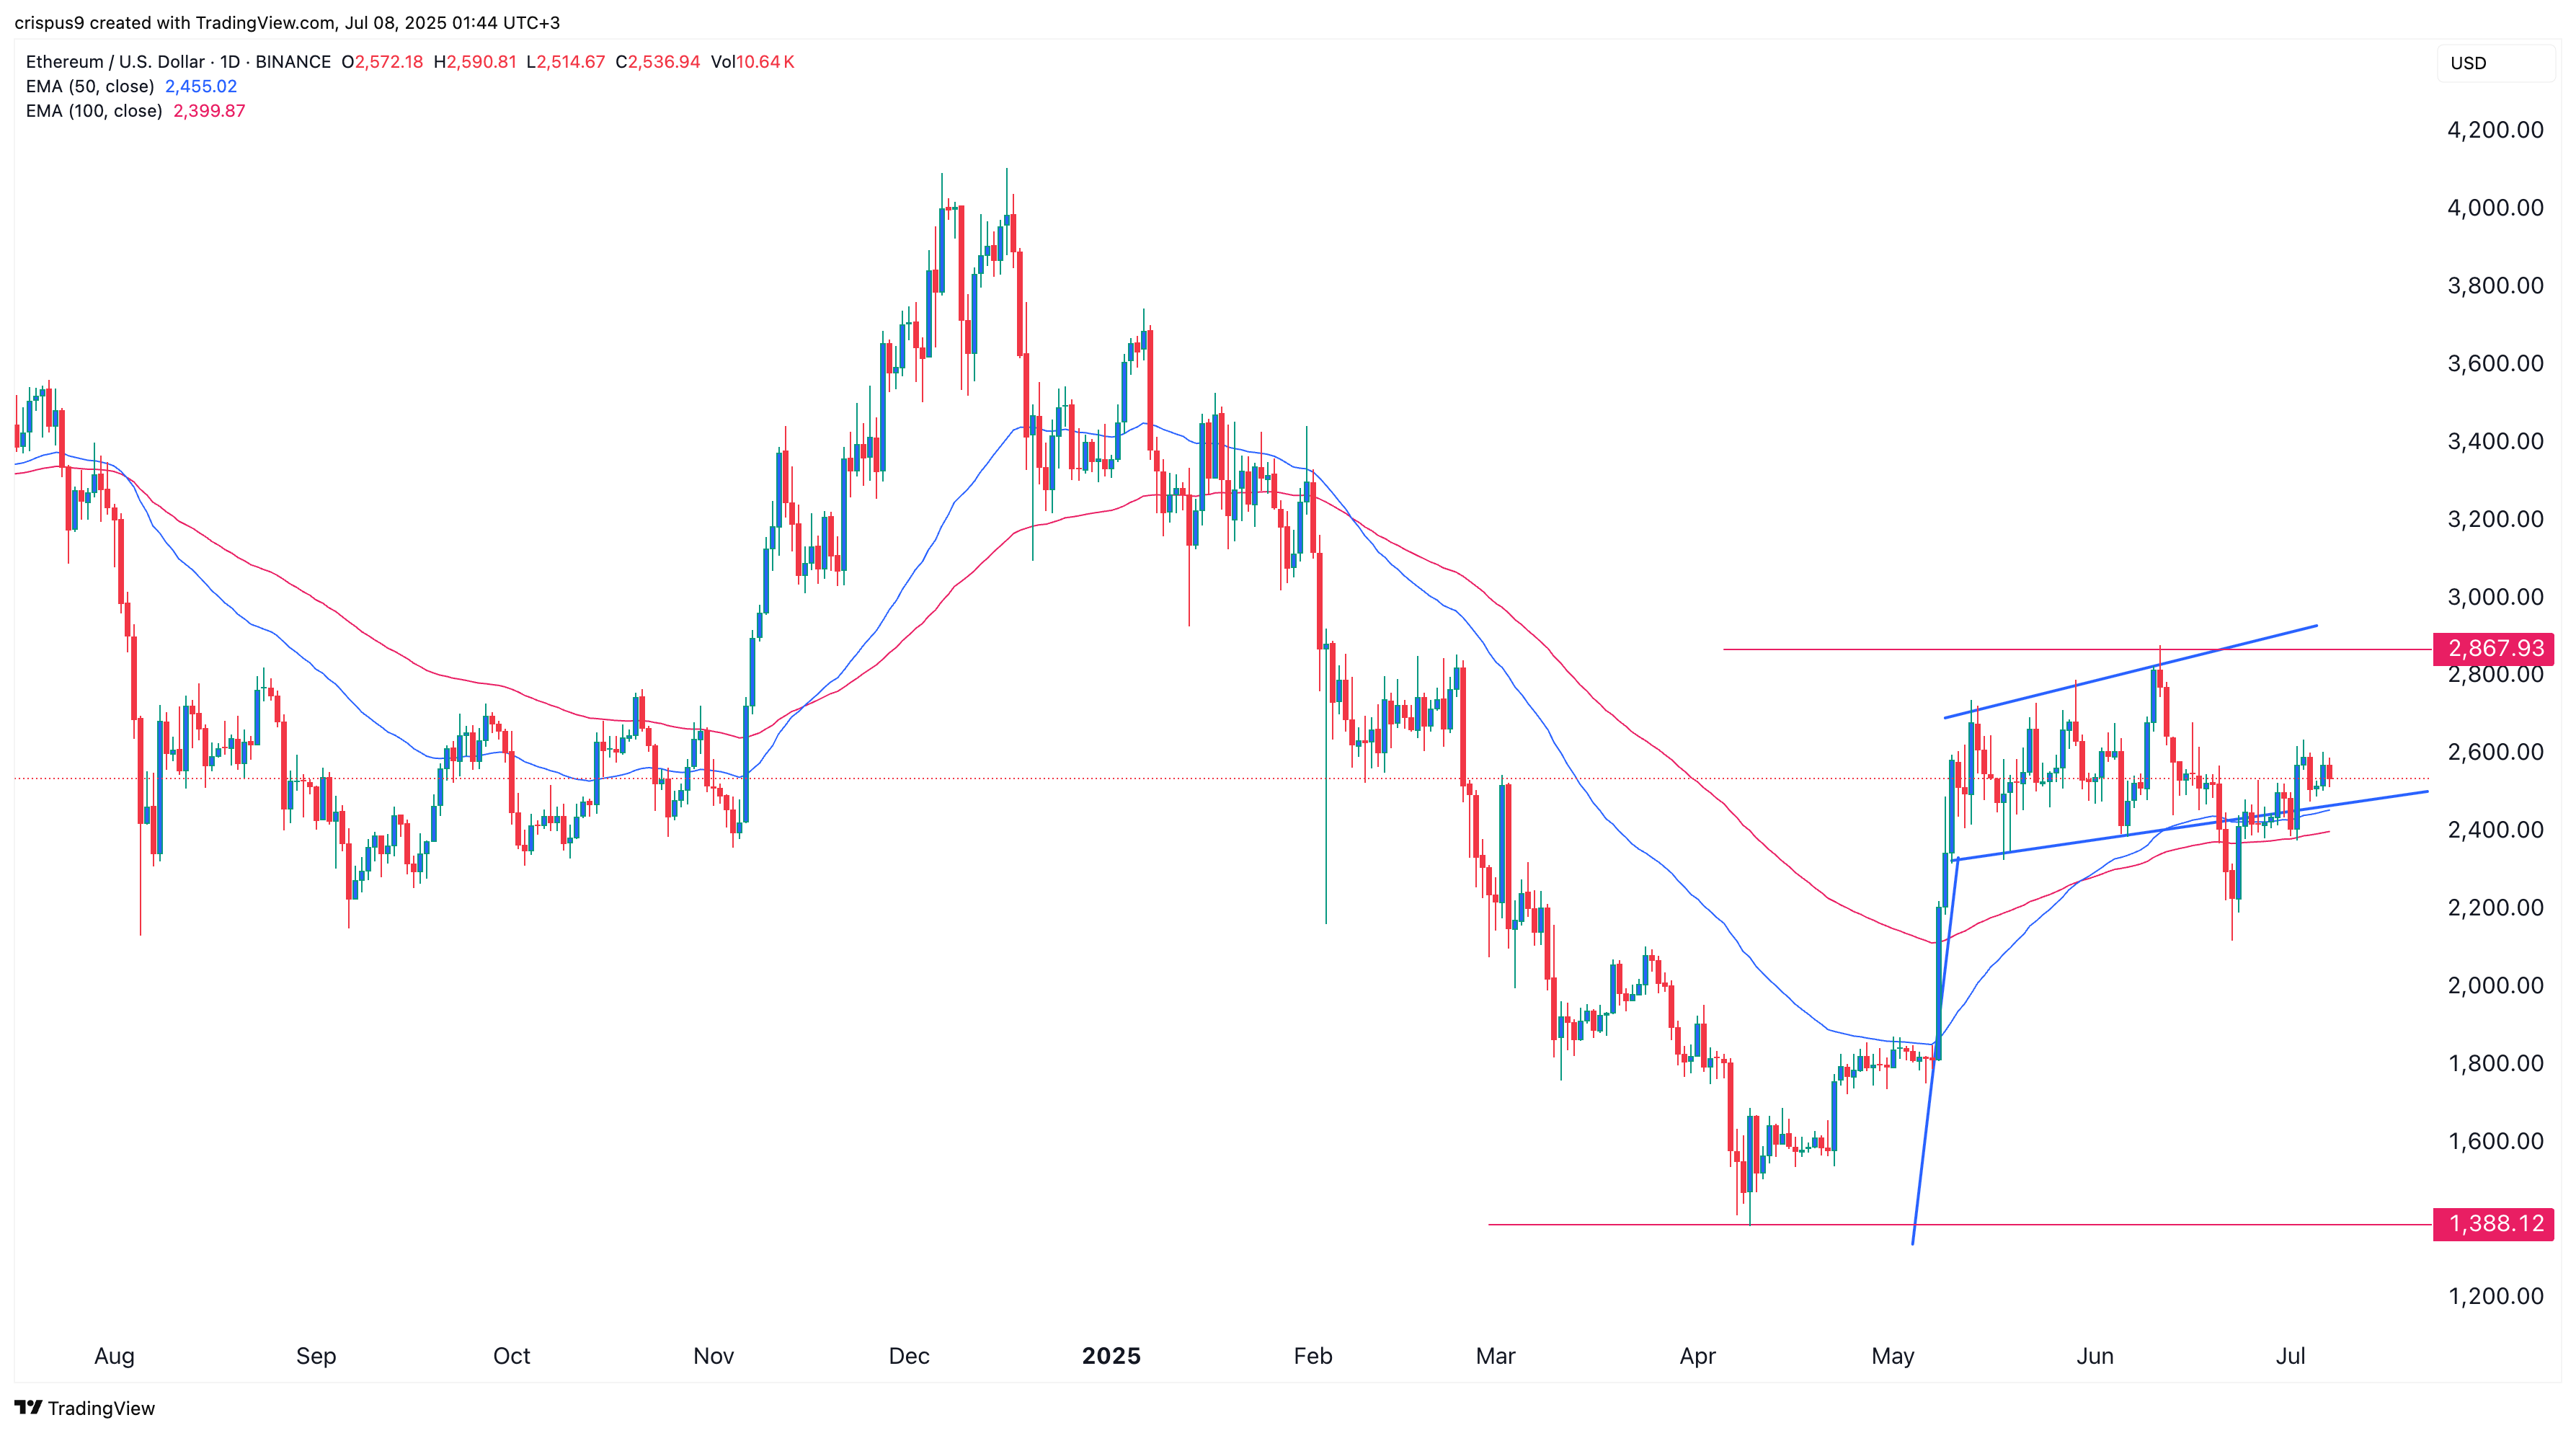
Analyzing the technical indicators, the daily chart illustrates that the ETH price has remained confined within a narrow trading range over recent months. Importantly, it has formed a bullish flag pattern and is currently situated in the flag section, which typically signals potential upward movement.
The price movement has positioned ETH above both the 50-day and 100-day Exponential Moving Averages (EMA), indicating that bullish sentiment is prevailing. If this momentum continues, traders may soon observe a bullish breakout, with a critical resistance level at $2,867 to watch for confirmation of this trend. A successful move beyond this threshold could set the stage for Ethereum to reach the psychological mark of $3,000.
READ MORE: Cardano Price Prediction: Here’s Why ADA is on the Brink

