

Four (FORM) has emerged as today’s top gainer, climbing 6% in the past 24 hours to trade at $3.33.
The recent uptick in FORM’s price signals a resurgence in trading activity and investor interest, with technical indicators suggesting a growing buying pressure. This momentum may pave the way for a potential retest of the token’s previous peak, enticing both traders and long-term holders to watch closely.
FORM Shows Accumulation Signs; Bears Losing Ground
Analysis of the FORM/USD one-day chart reveals intriguing developments. The Chaikin Money Flow (CMF) indicator has recently pivoted to a positive territory, indicating a notable increase in capital inflows. Currently at 0.01, this momentum indicator is on an upward trajectory, suggesting that bullish sentiment is beginning to take hold in the marketplace. For those craving deeper insights, explore the ongoing market analyses through detailed reports.
For token TA and market updates: Dive deeper into token insights by subscribing to Editor Harsh Notariya’s Daily Crypto Newsletter here.
The CMF indicator is pivotal in assessing the volume-weighted flow of capital into and out of an asset. A strong reading above zero generally means buying pressure dominates over selling pressure, while a dip below zero indicates a growing seller influence. With FORM’s CMF currently at 0.01 and rising, it signals an accumulation phase that bolsters the bullish case for a move back to its all-time high of $4.19.
Another critical aspect of trading momentum comes from the Moving Average Convergence Divergence (MACD) indicator. Recent sessions show a consistent decrease in the size of the red bars, indicating a gradual waning of bearish momentum. This pattern suggests that the bearish phase might be running out of steam, leaving more space for potential upward movement.
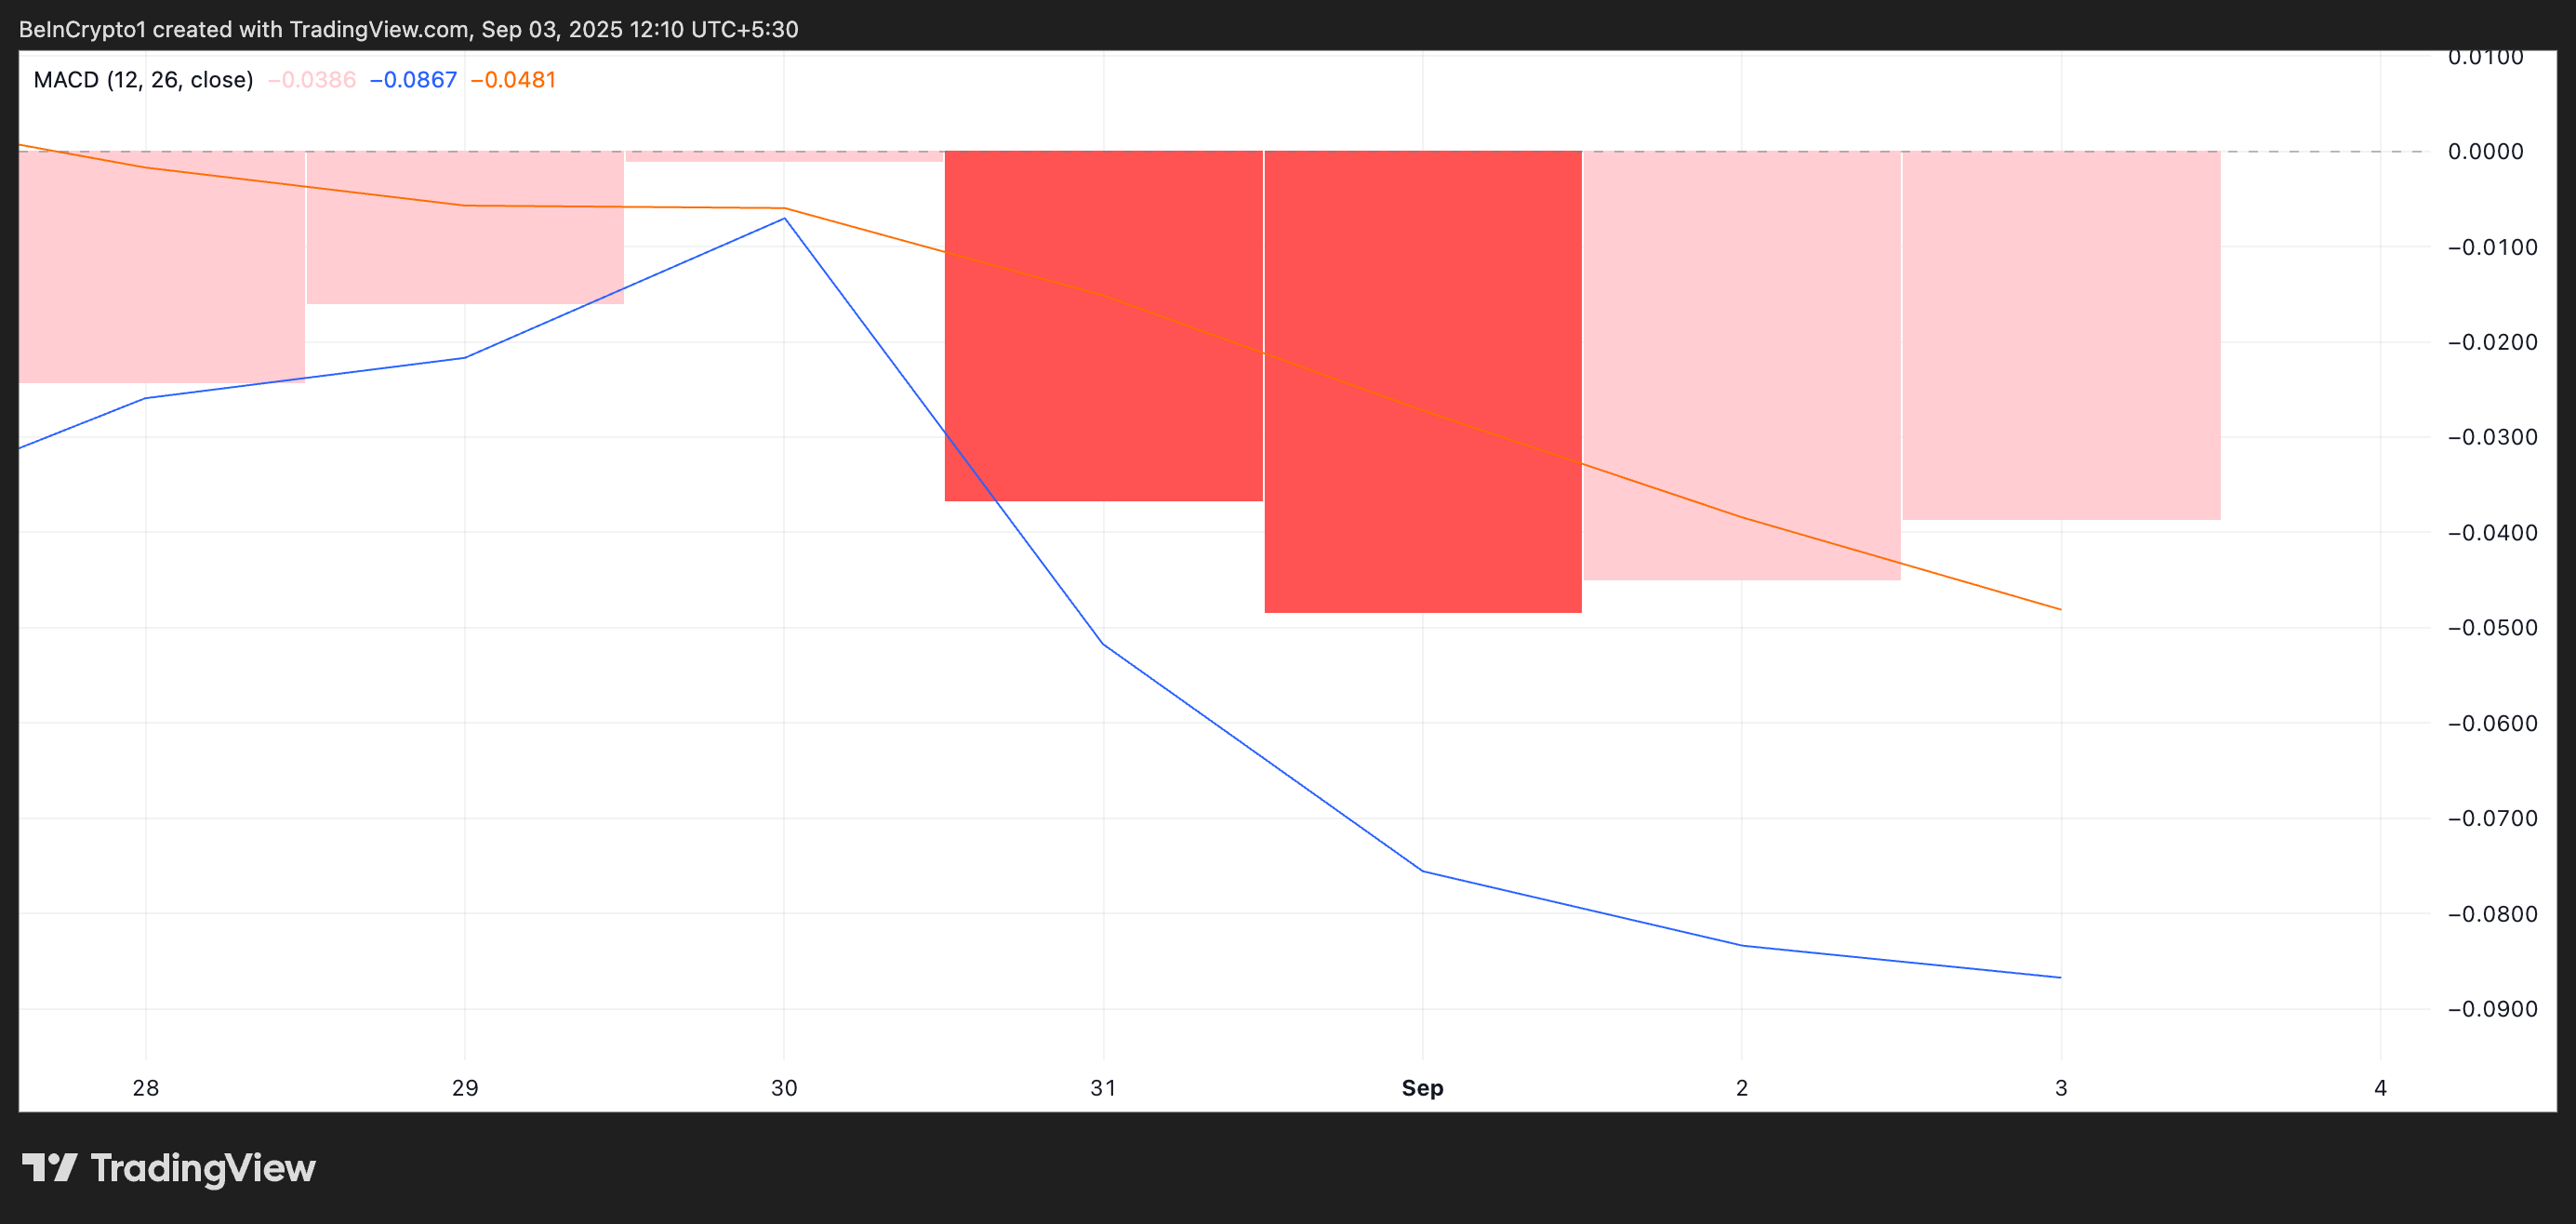
The MACD tracks the relationship between two moving averages of an asset’s price to gauge trend direction and strength. The diminishing size of red bars indicates that selling pressure is receding, and traders may anticipate a bullish crossover shortly. For FORM, this trend suggests that bears are gradually losing their grip, which may allow buyers to drive the price higher.
Will FORM Break $3.57 or Slide to $3.07?
As momentum builds, traders are closely monitoring the $3.57 resistance level. A successful breach of this price wall could transform it into a support level, setting the stage for a rally toward FORM’s all-time high. The anticipation is palpable, with many market participants eager to see how the price action unfolds.
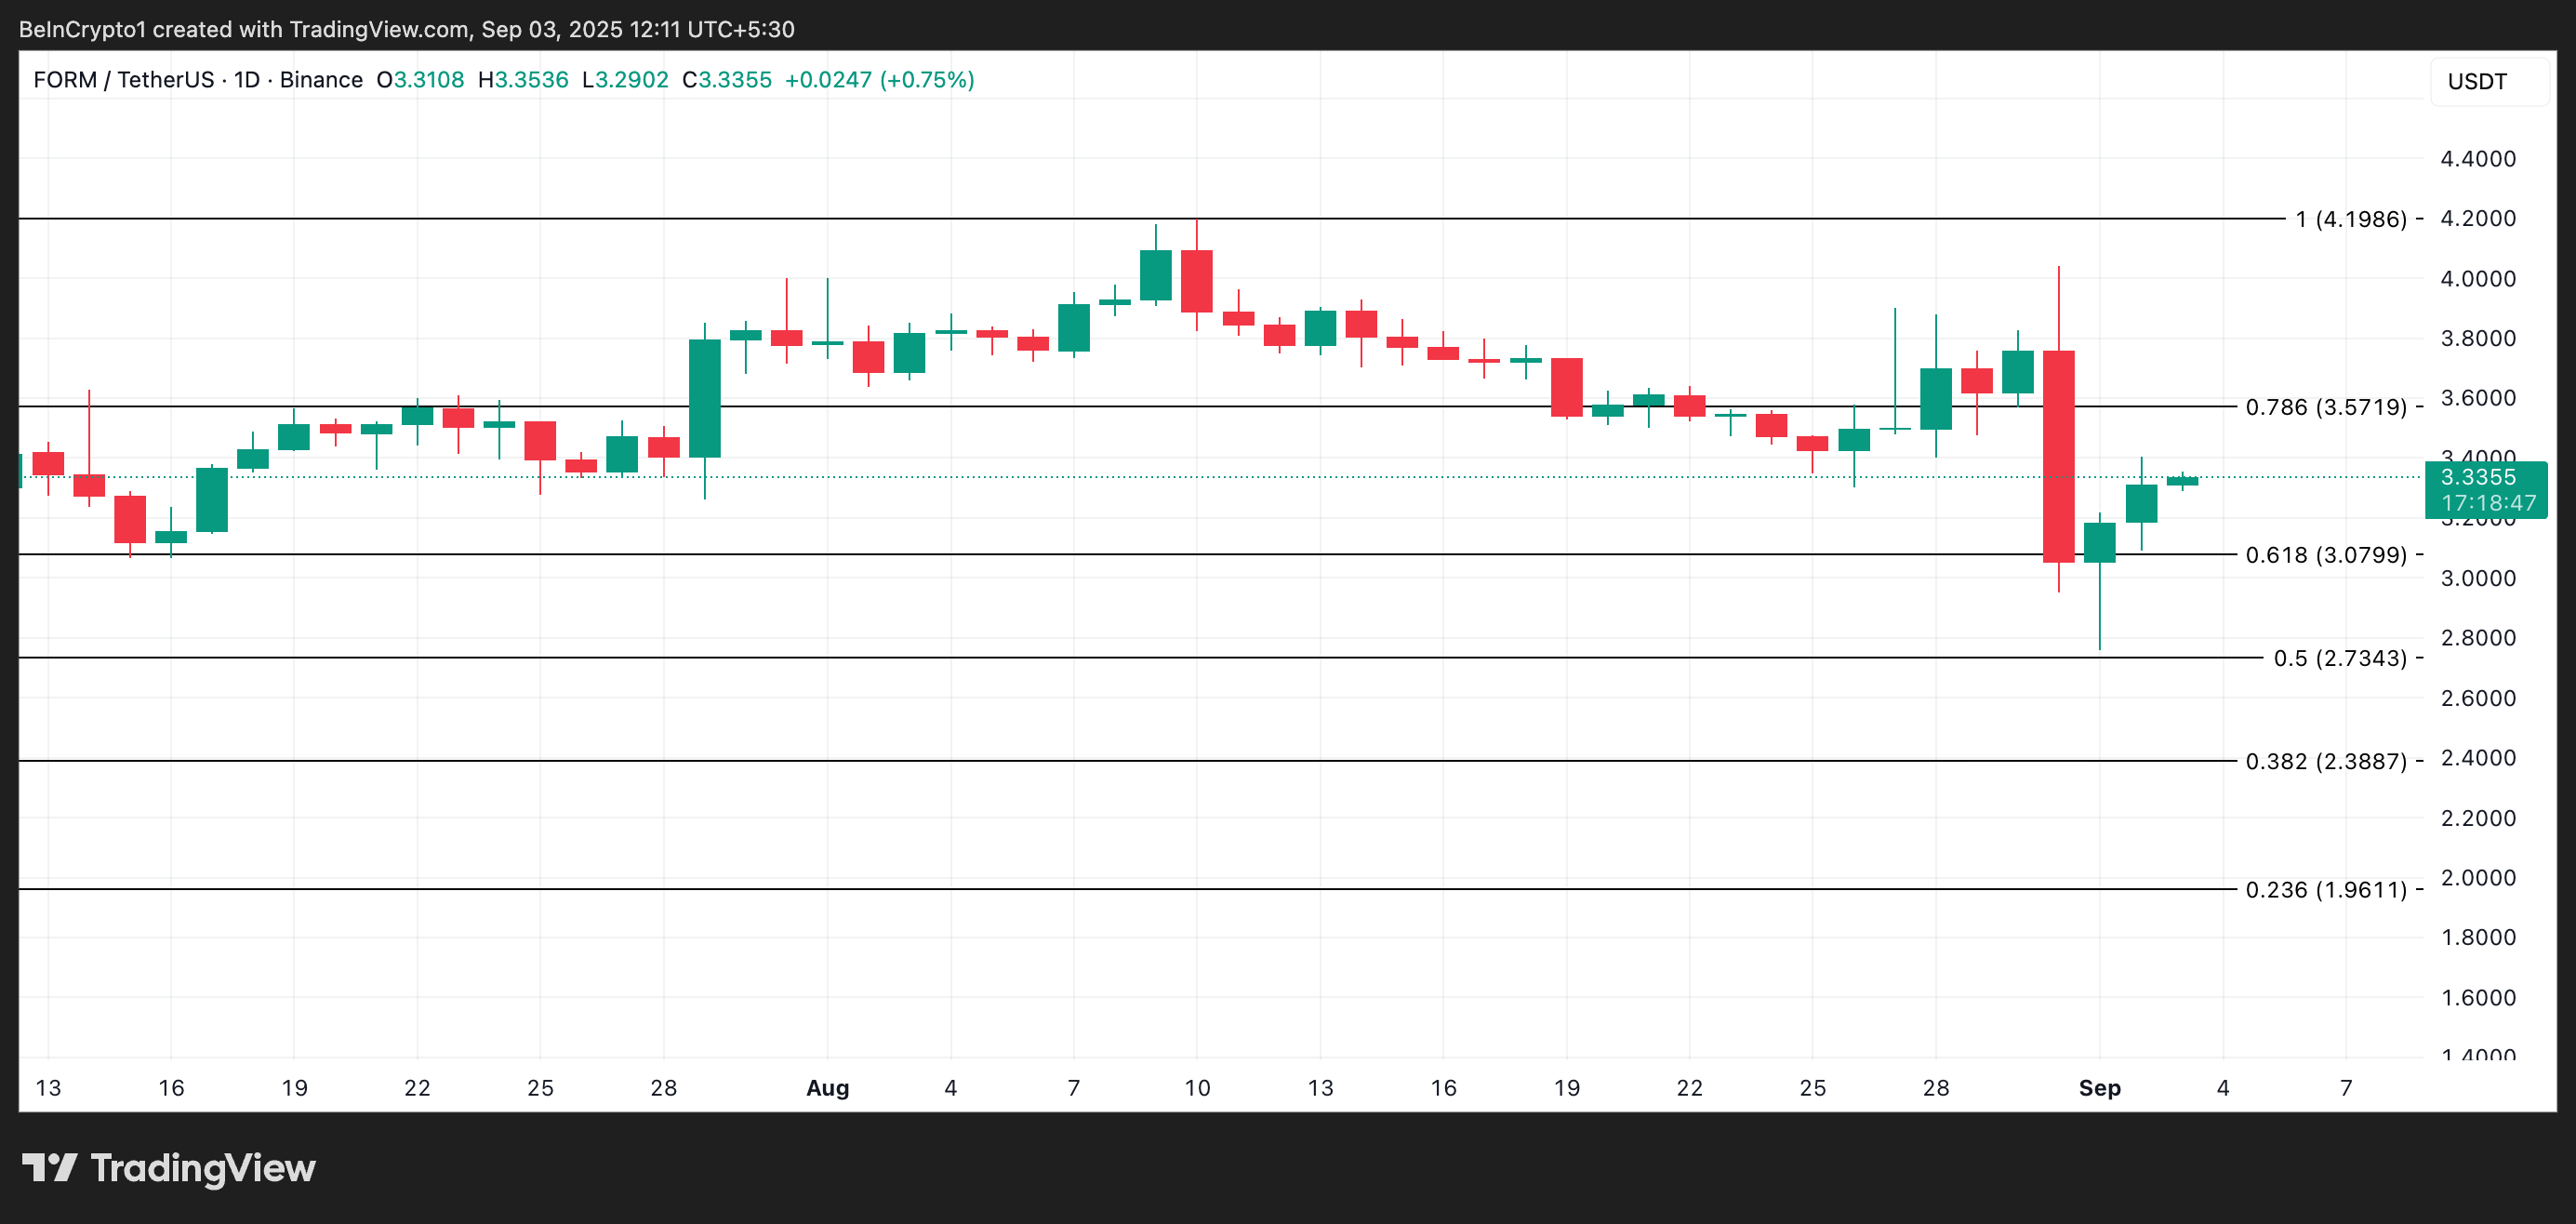
Conversely, should profit-taking begin, there looms the possibility of FORM retreating to $3.07. This price level may provide the next opportunity for bulls to re-enter if the uptrend falters. With varied scenarios at play, traders remain on high alert, navigating the ever-evolving crypto landscape.

