

Hedera Hashgraph and Its Native Token HBAR: Current Market Dynamics
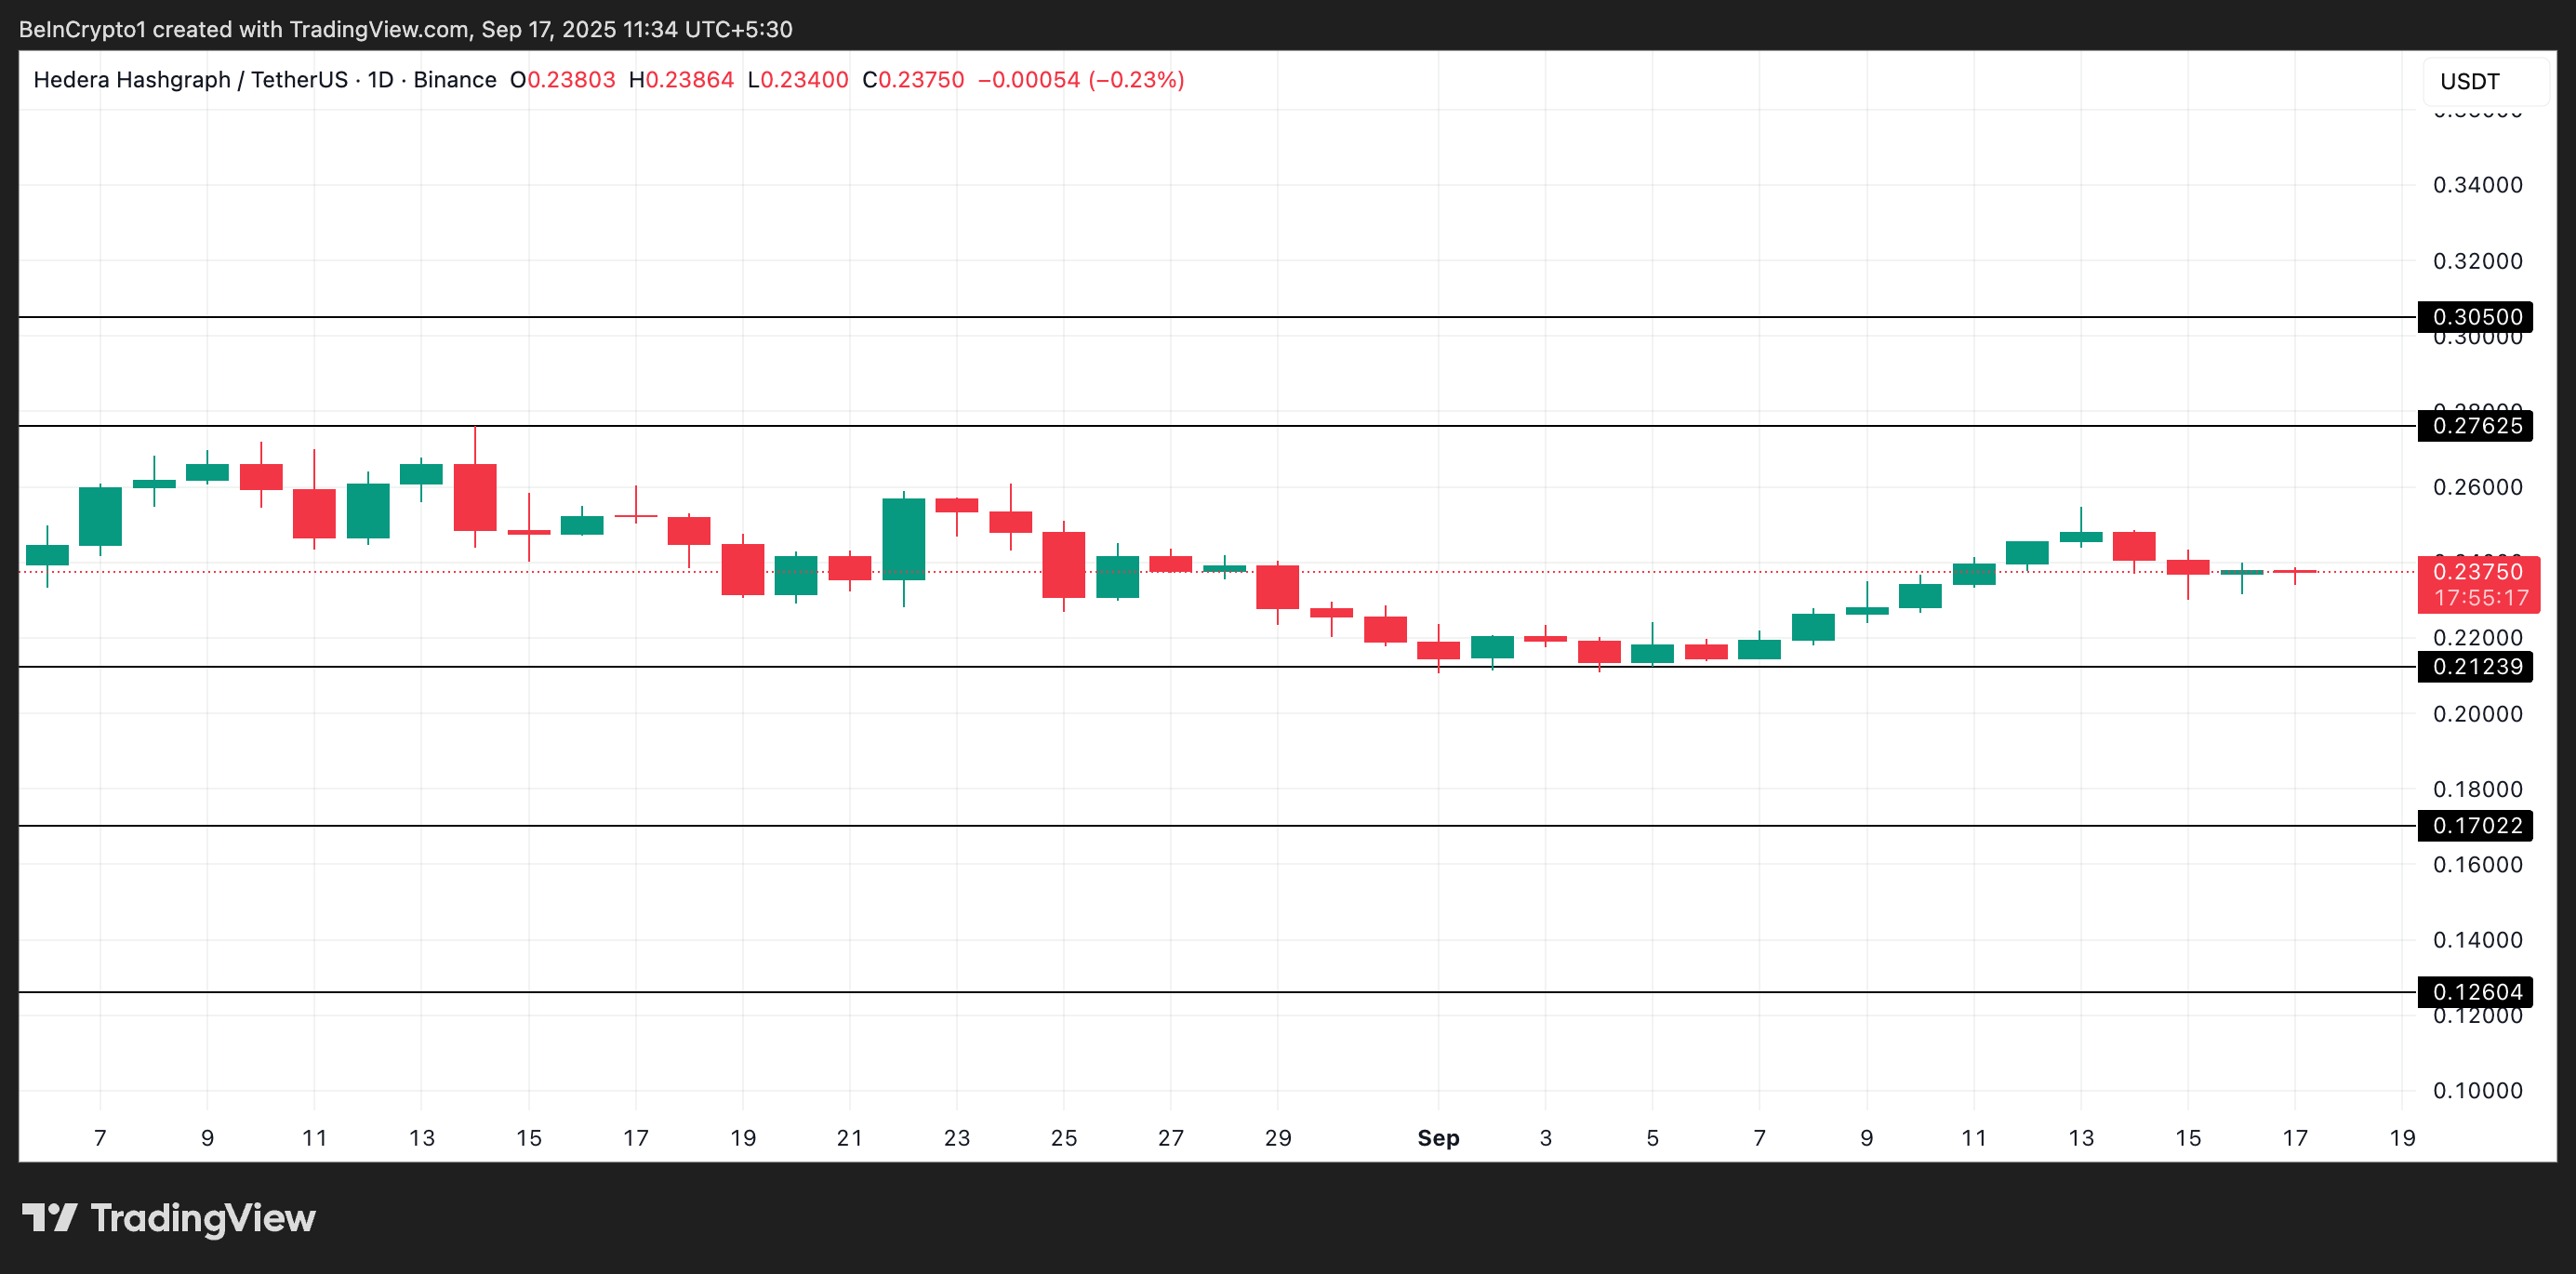
Hedera Hashgraph’s native token, HBAR, experienced a notable rise recently, reaching a 20-day high of $0.2548 last Sunday. However, it has since stumbled, with its price currently sitting at $0.2357—marking a decline of approximately 5% from its peak. This downturn calls for an in-depth examination of the underlying factors, including trader behavior, market sentiment, and technical indicators.
Market Sentiment: Bearish Trends Unfold
As HBAR’s price fluctuates, on-chain and technical indicators reveal a significant shift in sentiment among investors. With traders scaling back their positions, it becomes evident that optimism may be fading. The Money Flow Index (MFI), which assesses capital inflow and trading volume, has also shown a downtrend, suggesting a declining interest in accumulating HBAR tokens across the market.
The MFI is a vital tool in evaluating the health of an asset’s trading activity. It tends to increase when traders are actively buying, indicating robust liquidity and demand. Conversely, a decrease in the MFI—such as that being observed with HBAR—hints at a reluctance among investors to enter long positions. This slowdown could expose the token to further downside pressure.
Derivatives Positioning: A Bearish Tilt
Analysis from Coinglass adds another layer to our understanding of HBAR’s current standing. The long/short ratio for HBAR has fallen to 0.86, showcasing an increasing number of traders betting against the token. This ratio is critical in gauging market sentiment; readings below one indicate that bearish positions dominate. This trend reinforces the notion that investor confidence is wavering, supporting the broader narrative of a potential further decline.
Implications for HBAR’s Short-Term Prospects
The current state of capital inflows and a rise in short demand signal a precarious environment for HBAR. If buying support does not materialize to counterbalance these bearish trends, the price may further decline to around $0.2123 in the coming sessions. This potential dip raises concerns among investors about the token’s stability.
Potential for Recovery: The $0.2762 Rebound
Despite the current bearish grip on HBAR, there is a silver lining for bullish traders. Should momentum shift and accumulation begin anew, HBAR could experience a resurgence, rallying toward the $0.2762 mark. This price point could serve as a critical resistance where traders would need to assess their strategies closely.
Conclusion: Navigating the Uncertain Waters of HBAR
As traders adjust their positions and sentiment shifts towards the bearish side, HBAR navigates through uncertain waters. Monitoring the MFI and long/short ratios will remain crucial as these indicators may provide further insight into market trends. The landscape could evolve quickly should bullish sentiment regain momentum, but for now, caution prevails in the world of crypto trading.

