

Pi Coin is one of the rare assets showing green amid a crypto market that is predominantly red this month. While Bitcoin has plummeted around 20% and Ethereum has seen a nearly 27% drop month-on-month, Pi Coin’s price has surprisingly risen by almost 18%. Despite a recent 5% dip, its overall monthly trend remains positive, positioning Pi Coin (PI) just 6.5% away from a potential breakout. Let’s delve into the factors contributing to this unusual strength.
Money Flow Strengthens the Uptrend
The Money Flow Index (MFI) provides an early indication of strength in Pi Coin. MFI, which factors in both price and volume, helps determine whether buyers or sellers dominate the market. On November 16, Pi Coin broke above its MFI trend line, coinciding with its rising price.
Since November 14, Pi Coin has climbed nearly 26%, with the MFI breakout hinting at early buyer activity. Although the MFI has pulled back slightly, it remains above the trend line. This suggests that any dips in price are likely to be mere pullbacks rather than indications of a full reversal.
A further supportive indicator comes from the On-Balance Volume (OBV), which also broke its trend line on November 18—two days post-MFI breakout. OBV tracks the volume flow into and out of the asset. A late OBV breakout implies smaller traders may have joined after larger wallets made the initial moves. However, it’s important to note that OBV remains in negative territory around –1.84 billion, characteristic of a downtrend.
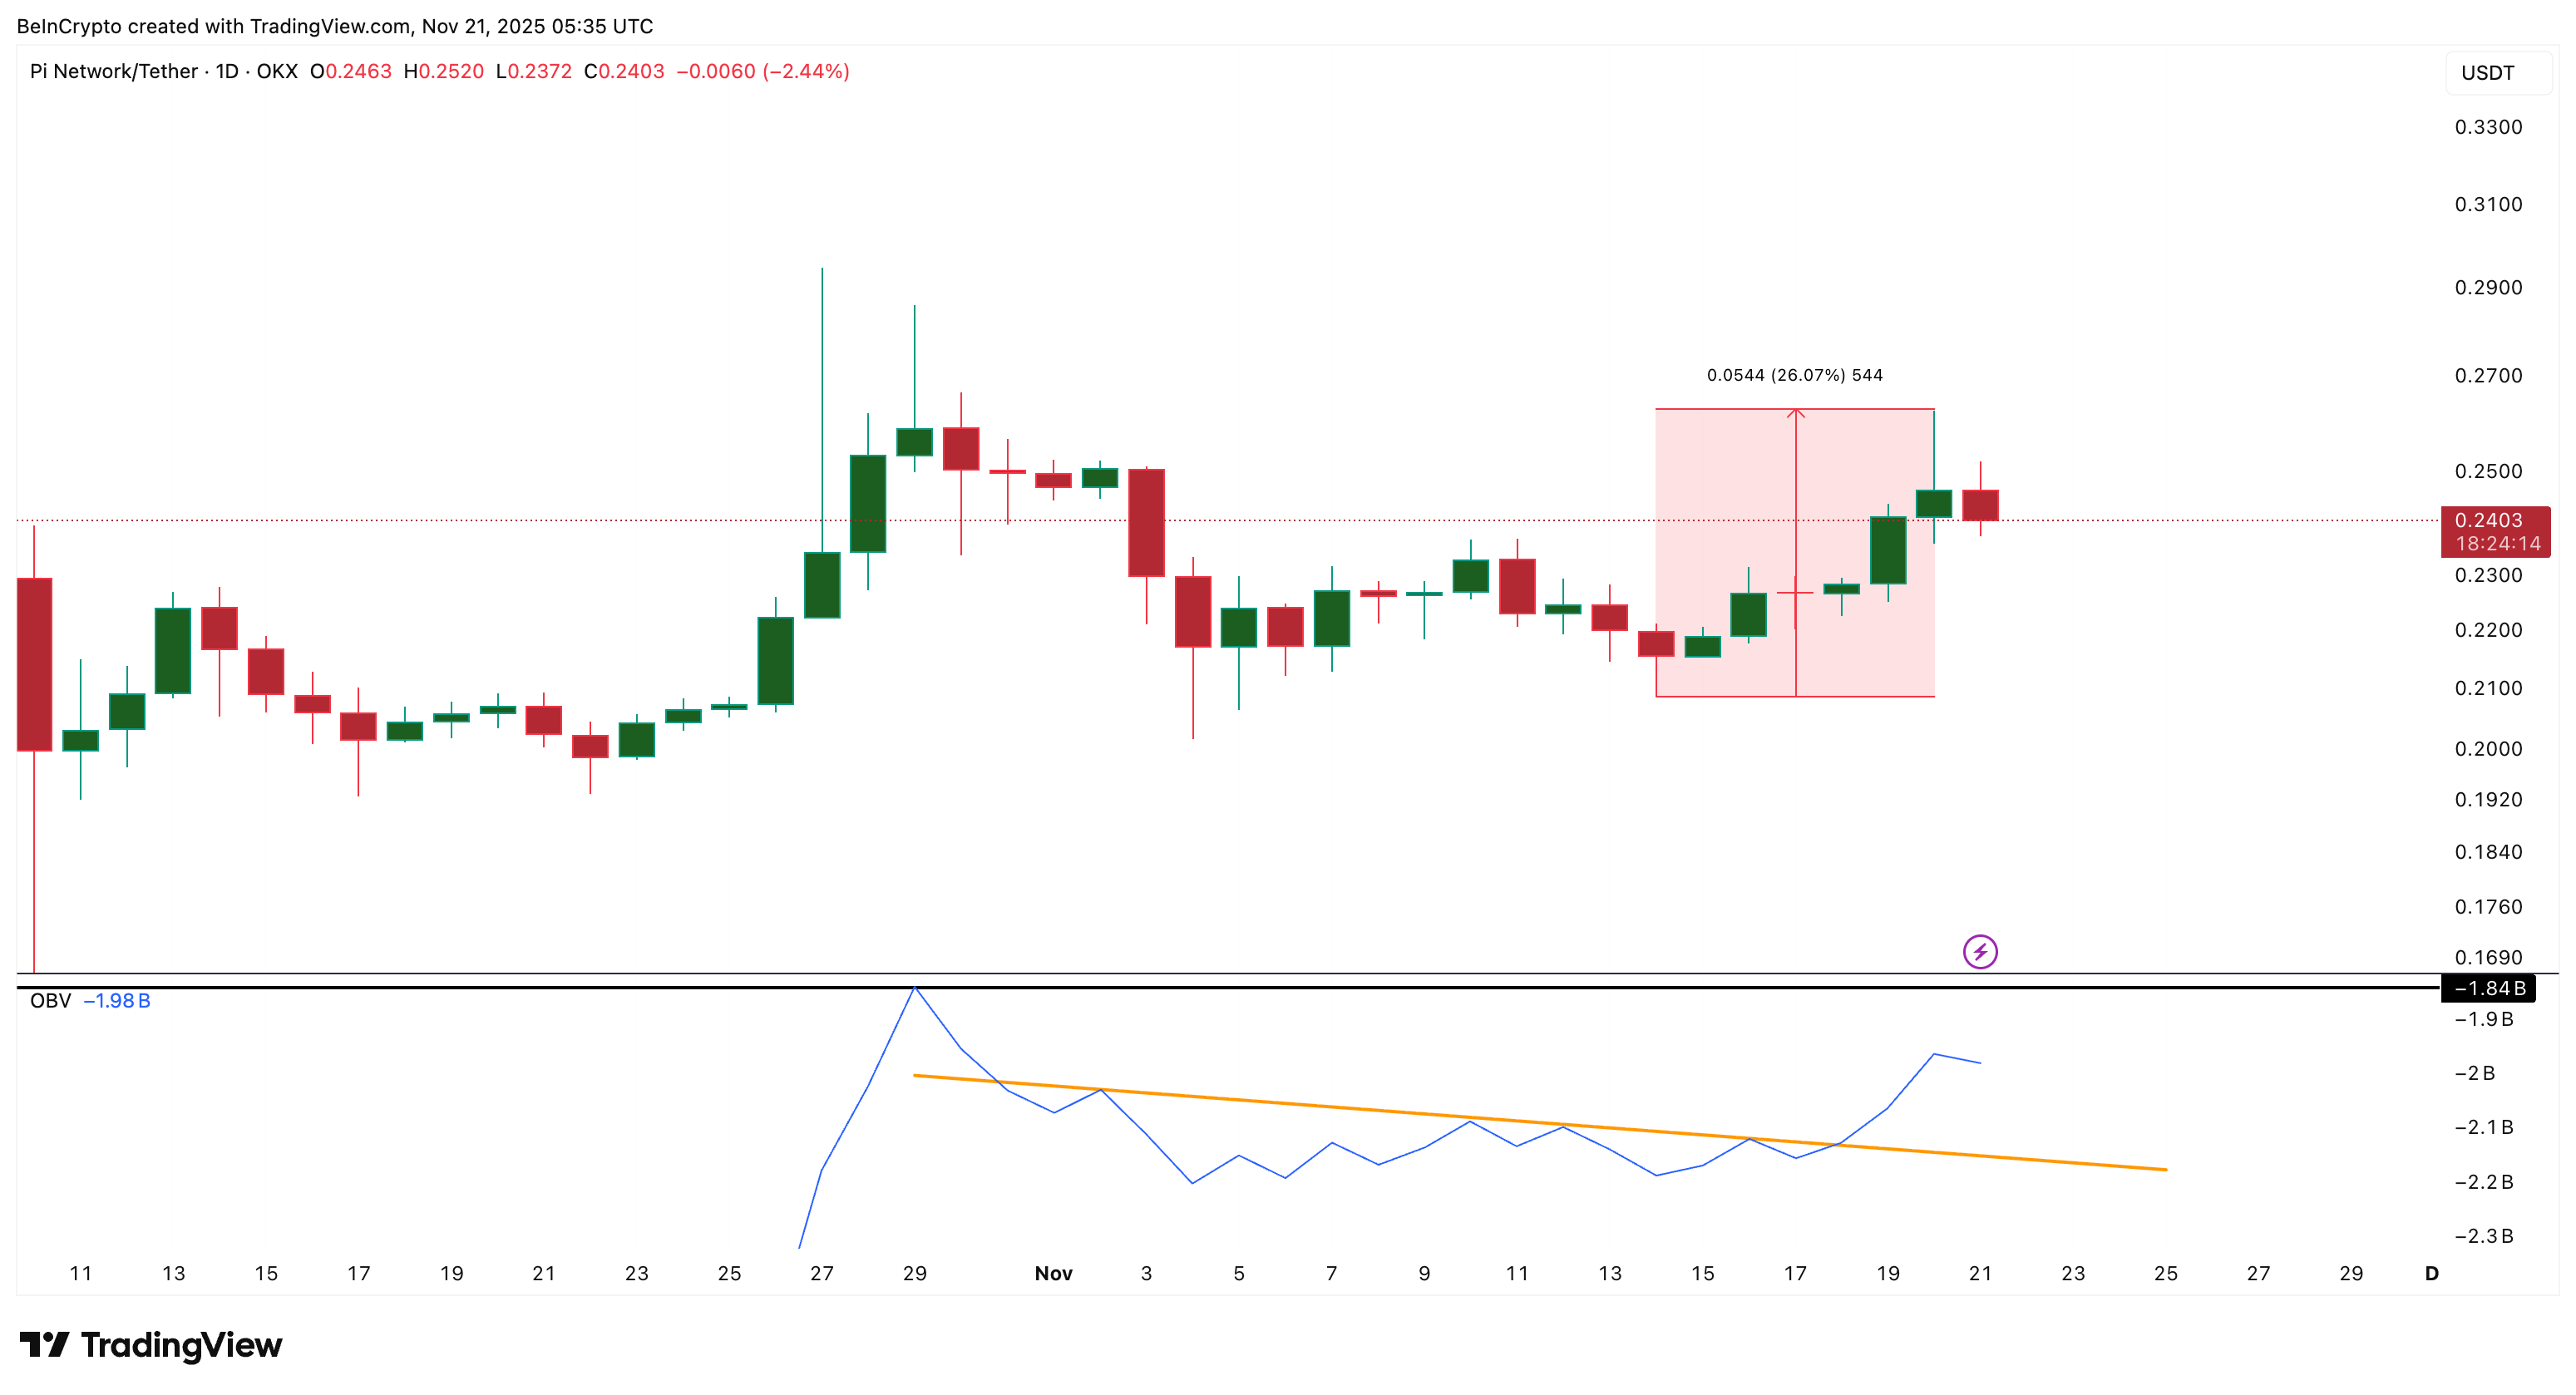
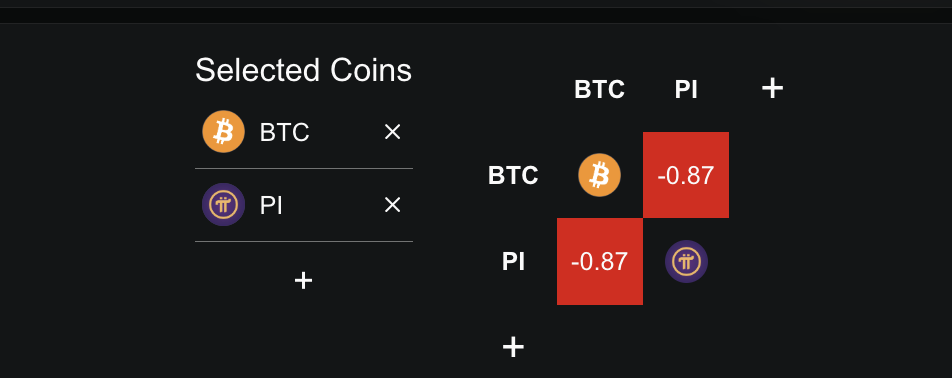
Nevertheless, the upward slope of OBV points to improving demand. For the short-term trend to strengthen further, clearing the –1.84 billion mark would be crucial. Adding an interesting twist to the narrative, the seven-day correlation between Pi Coin and Bitcoin is at –0.87. This Pearson coefficient indicates that as Bitcoin moves down, Pi Coin reacts positively, which explains its relative strength during this market downturn.
An Upcoming Crossover Builds a Bullish Case
Insights from the 4-hour chart bolster the bullish sentiment. Currently, Pi Coin trades above all major exponential moving averages (EMAs), and the 50-period EMA is approaching a cross with the 200-period EMA. This crossover, known in trading circles as a golden crossover, indicates that short-term price momentum is catching up to longer-term trends.
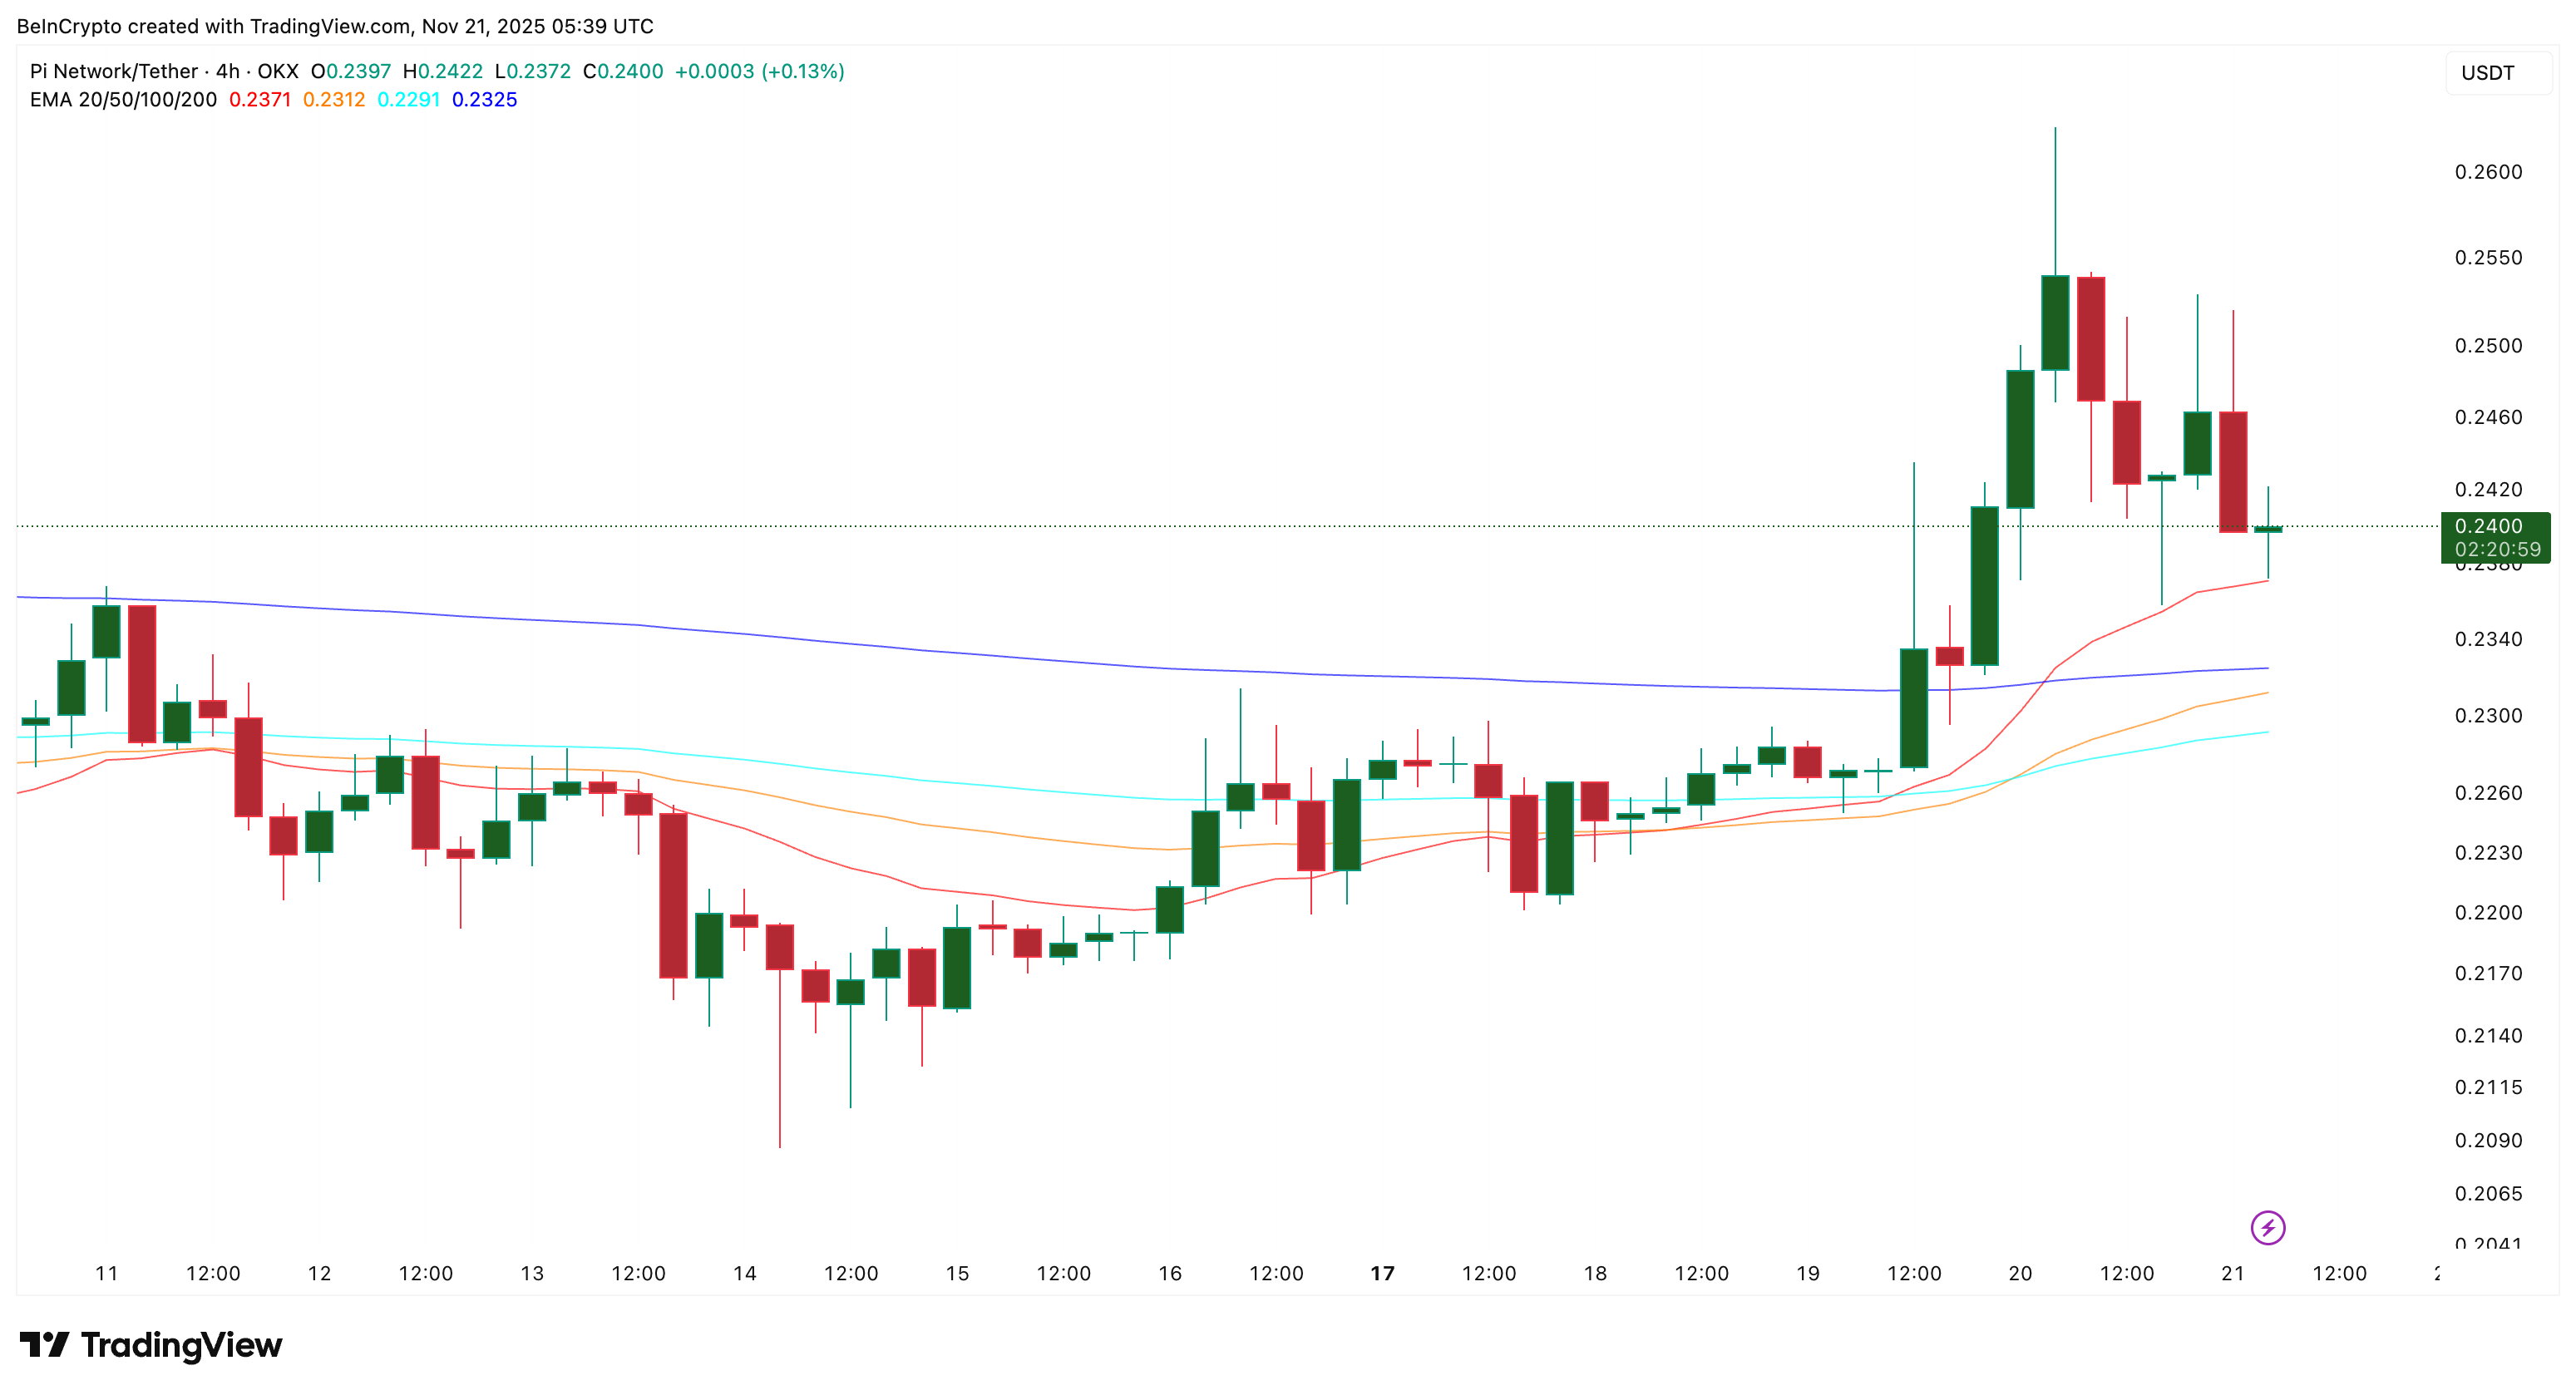
EMAs are known for their ability to react swiftly to recent price changes, making them a valuable tool for identifying short-term trends. Should the 50-period EMA successfully-cross above the 200-period EMA, it would further solidify the argument for Pi Coin’s continued upward momentum.
Pi Coin Price Levels to Watch
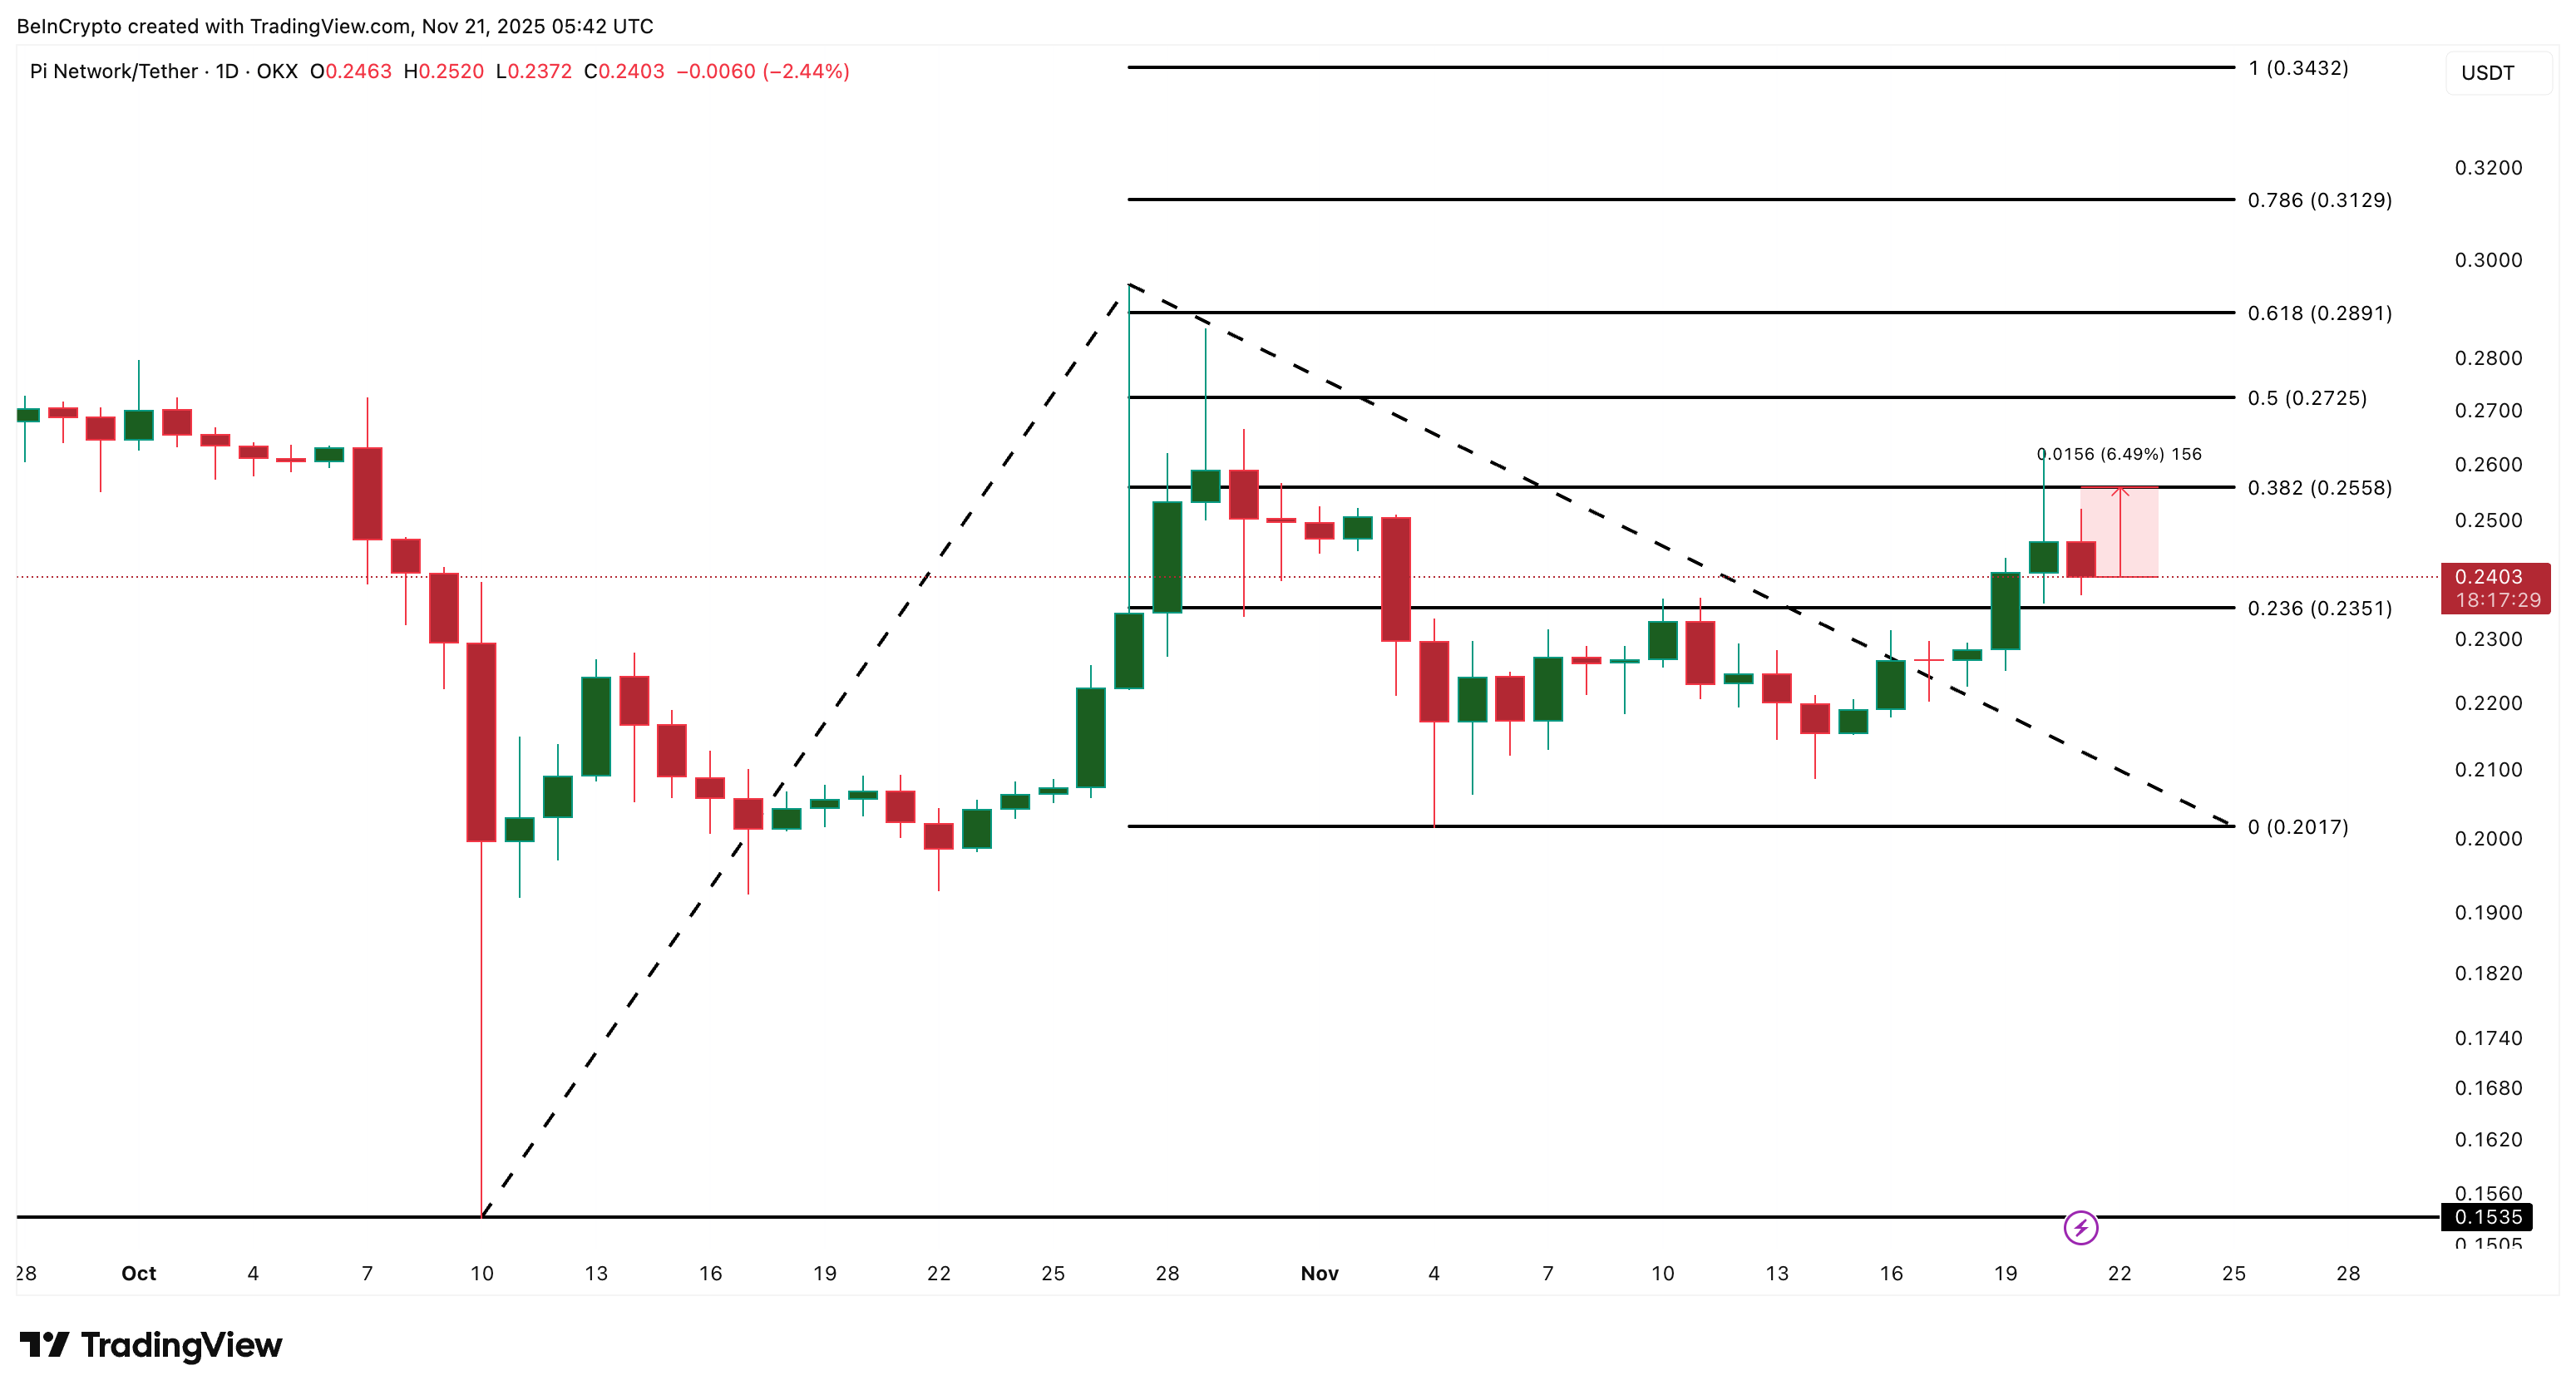
Trend-based Fibonacci extensions reveal significant resistance near $0.25. A clean daily close above this threshold is essential for unlocking the next potential wave of growth, requiring a movement of about 6.5% from the current price. Surpassing $0.25 could pave the way for Pi Coin’s rally to extend to levels of $0.31 and $0.34.
Conversely, the key support level is positioned around $0.23. A daily close below this point could escalate the risk of a decline toward $0.20, jeopardizing much of Pi Coin’s recent progress.
Amidst a predominantly negative market, Pi Coin stands out as one of the few green assets this month. If buyers can propel the price upward by 6.5%, we could witness a fresh breakout attempt looming on the horizon.

